Table of Contents
Intro
Goals
Overall Risk
Methodology notes
Political Factors
Demographic Factors
Life and Satisfaction Factors
ML Classification Tree
Summary
R Code
Introduction
Alright, so about three months ago Scott Alexander of ACX and SSC fame released his 2022 reader survey which included two questions on cancellations: “Have you cut off any family members over politics?” and “Have any family members cut you off over politics?”. Of the roughly 7,000 people who responded, 442 answered yes to one or both of these questions. The following is an exploration of who these people are, using their answers to about 160 other questions ranging from demographics to political views to life satisfaction.
Goals
Sooo…I know there’s a lot of debate and opinions and “discourse” around canceling and cancel culture and I certainly have opinions but, uh…who cares? I don’t think discussions about whether canceling is good or bad or justified or whatever are…terribly productive at this point and I really want my analysis to drive real action in your life. In fact, specifically, I’d like you to help you identify
• How at risk you are of being cancelled
• How to identify friends and family who are likely to cancel you.
What action you take with this information is certainly far more specific to your circumstances than I can cover here. I’m just going to assume that you share the deep fear of ostracization from friends and family that goes back to the Greeks and…you also don’t want to live a life of pointless paranoia and fear. Hopefully this will help you calibrate what the real risks and danger signs are and which signs can and should be ignored.
Overall Risk
Broadly, out of 6,926 survey respondents, 200 people or ~2.8% reported being canceled, 310 or 4.4% reported canceling someone and, with overlap, 442 people either were canceled or canceled somebody or 6.4%. So there’s sample bias, we’ll see large groups with a risk of 6% or higher and fringe groups with reports above 10% but overall…yeah, I’d say 3-5% sounds fair.
This…this is a weird amount. Especially because, remember, this is lifetime amount, has this ever happened, not whether this happened in the past 5 or 10 years. And while “cancellation” is a new phenomenon, the phenomenon of families splitting apart over politics is old.
But, um, I would phrase this as you having a…somewhere between 1 in 20 and 1 in 30 chance of being cancelled in your lifetime. This is not a high chance but it is higher than a lot of other things people are scared of. For comparison, your lifetime odds of dying in a motor vehicle collision are about 1 in 90, as are your odds of being killed by a gun. Don’t take these too literally but rather as ballparks. Probably the best comparison is your overall odds of dying from a “preventable cause”, which are about 1 in 20. Ya know, if you’re in America, you’re remarkably safe…and you still take precautions.
Also, remember this is only canceling family members, not friends or work colleagues. Maybe it’s optimistic and naïve but I really hope people are more likely to cancel friends and colleagues than family…but that would indicate these numbers would be substantially higher. Calibrate yourself appropriately.
Methodology Notes
Alright, three big ones. First, remember the population. The group we sampled from is not a random sample of Americans or people in general, it is a heavily selected group of…basically white computer nerds who, for some reason, are disproportionately trans. If you came here from ACX or you sound like that group, these results are pretty directly applicable to you. If not, you should adjust how applicable this is to you accordingly.
Second, I’m very aware of the multiple comparison problem and we almost certainly are going to get some things wrong. Just the intuitive take on p-hacking…every time we analyze two groups, there’s a small chance of us finding something that looks like a significant difference and it’s actually just statistical noise. We’re all nerds, we’ve all rolled a D20, this kind of analysis is just like rolling D20, the more times you roll, the more likely you are to roll a “1” or critical failure. When we look at, say, political affiliation or political party and how cancellation rates vary there, that’s like rolling the die once for each party. It’s very clear that we’re going to get some false positives and false negatives. I’ve done my best to limit this analysis to only relevant factors but…we’re still going to get a lot.
Third, in general, I trust self-reporting of canceling someone else higher than self-reporting of being canceled. Not only is there a lot of hype and fear about canceling that could cause someone to misreport but…it’s easy to imagine someone being a jerk, people avoiding them, and that being misinterpreted as being cancelled. But when someone say’s the intentionally quit communicating with someone over political differences, there’s a lot less ambiguity; they’re the ones that did it and they know why.
Political Affiliation
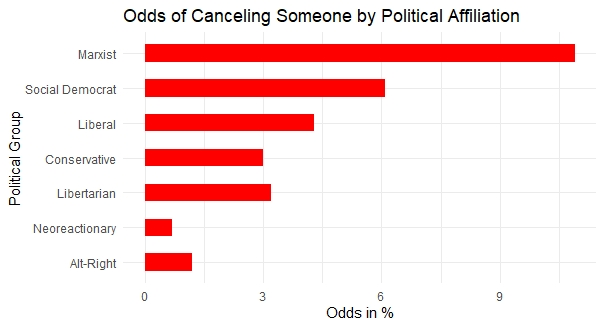
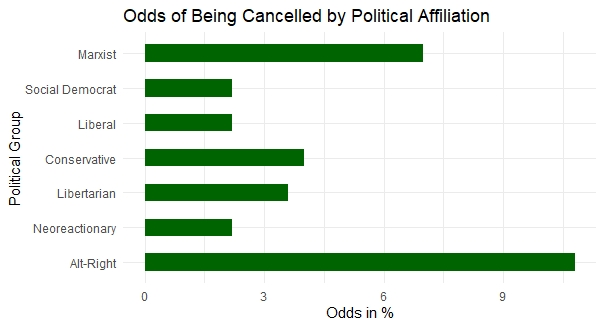
Alright, so this part is going to confirm…basically all the conventional wisdom. We’re looking at about five different factors and they all tell basically the same story: cancellation is broadly done by liberals to conservatives at about a 2:1 ratio with the exception of people at the extremes, who all cancel people at elevated rates.
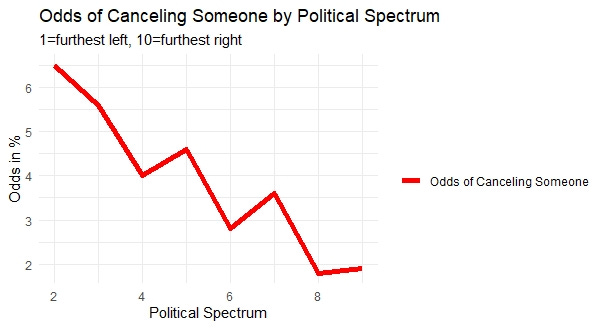
Pretty straightforward, calculated the odds in % of the person reporting having cancelled a family member by political spectrum, with 1 being the most liberal to 10 as most conservative. Honestly, this is about as linear a correlation as you’re likely to see outside of a classroom. Clever readers will have noted that I’ve excluded the extremes of 1 and 10, that graph is coming up in a minute.
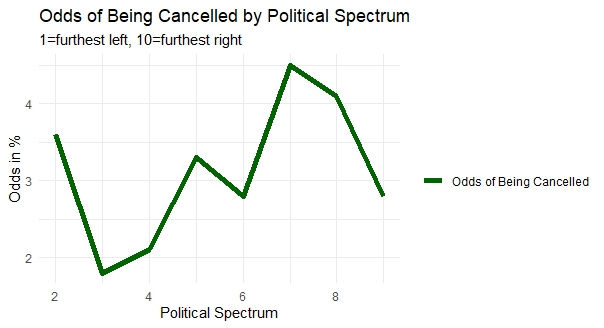
Still a pretty reasonable linear relationship but definitely less clear and there’s something going on at the extremes. Cut off liberals at 2 and conservatives at 8 and 9, perfectly clear linear relationship but…yeah, something more is going on with the extremes here. Two notes: on both of these graphs there’s no discontinuity or change around moderates, say at 5 or even 4-6, and no indication that there’s any moderating or balancing effect, also the deep conservatives at 8-9 reporting lower cancellation rates is odd because,
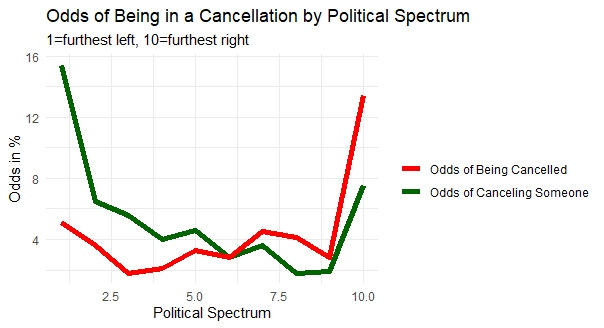
This is the same graphs, overlaid, with the extremes included, and it’s immediately apparent that people at the furthest ends, either way, are extremely likely to cancel or be canceled. It’s pretty clear these effects aren’t perfect mirrors, extreme leftists are only slightly more likely to be canceled than other an 8 or 9 conservative whereas the extreme rightists are way more likely to both cancel and be canceled, which is weird when reflecting that conservatives at 8 or 9 show decreased risks of cancellation. I dunno, something funky is going on there but it’s definitely safe to say that the ideological extremes are at highly increased risk.
Let's just clarify here that, while there were not a ton of Alt-right or Marxist respondents, we did get between 80 and 130 respondents each for Alt-Right, Neoreactionary, and Marxist. So not tons of respondents but a respectable sample.
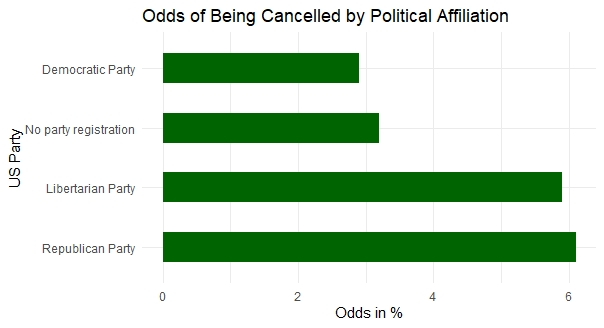
Note here that we dropped a large potion of the sample, as they did not enter a party and were not American, if you're curious they acted pretty similarly to the Democratic party. Let me also note again by confusion by the absence of "moderates" being moderate. People without a party, just like people in the middle of the political spectrum, don't show a reluctance or avoidance of cancellation, they fit very cleanly onto this linear trend of left cancellation to right being cancelled.
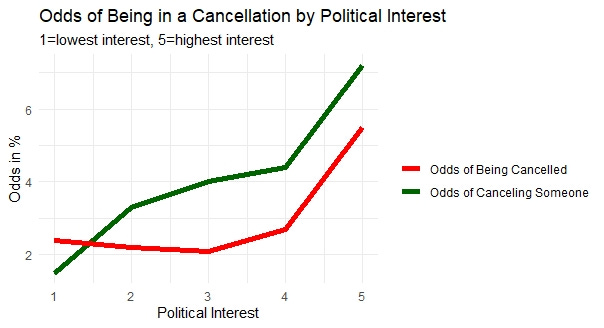
As expected, the more involved someone is in politics, the more likely they are to be in a cancellation.
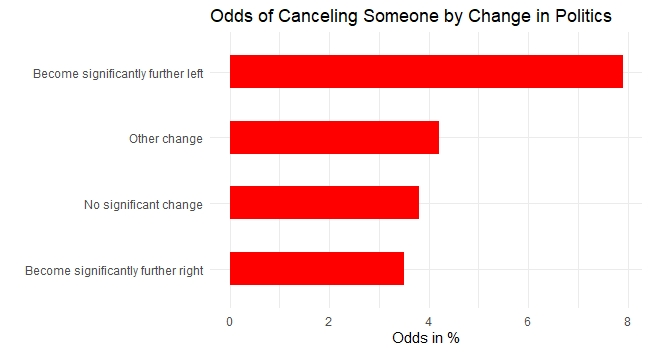
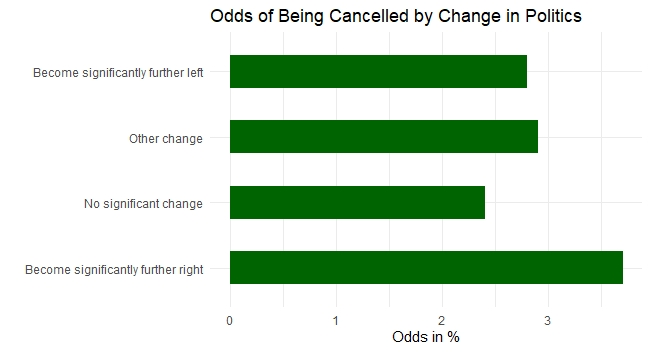
And finally, how people's political views have changed over the past few years. Oddly, changing your politics doesn't have a huge impact in your odds of being canceled but it does have a significant impact on your odds of canceling someone.
So, let me make a quick note here before moving on. I'm concerned a lot of these differences might seem like a big deal, and they might be at the aggregate level, but they're probably not for you. To take the inflammatory example, your odds of being canceled as a Republican (6.4%) are more than twice that of a Democrat (2.9%) and I'm sure plenty of people have certain opinions about that but a risk of 3% vs 6%...isn't really actionable. It's not real, your brain doesn't calculate like that and mine sure doesn't. In terms of actionable, real insight, I can only say that you should be careful around extreme leftists, Marxists, and people who have recently moved significantly to the left and be extremely careful if you're in the Alt-Right. Those are the only risk factors that are going that shift you up to a 10% or more risk of being canceled.
Demographic Factors
Alright, these results were highly counter intuitive. I'll give this a full discussion at the end; for now just know that these results, while interesting, are not definitive.
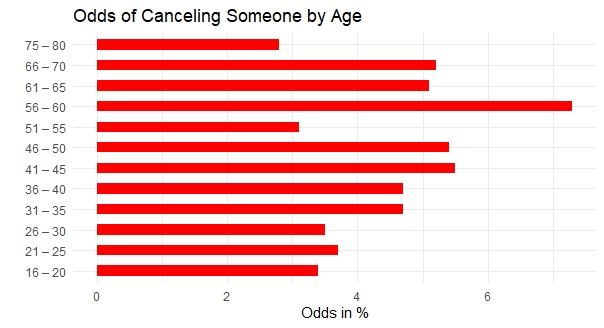
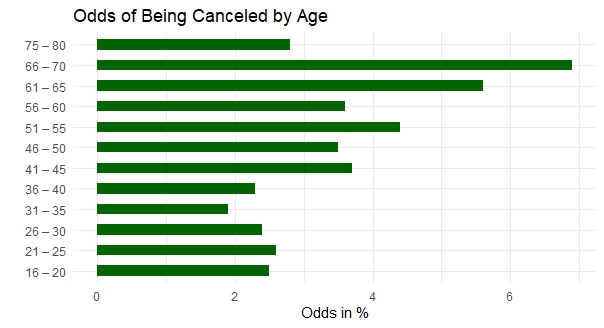
So political cancellations are typically thought of as a young persons thing, or at least a primarily Millennial activity. But honestly, I'm not seeing it. I think a lot of this comes down to a simple underlying truth, cancellation meaning breaking family relationships has been going on for a long time and if you've been around for 60 years, you've simply had a lot more time to break those relationships. It's easy to imagine people fighting over the dinner table over Reagan or LBJ. Remember that the question is phrased to represent whether this has ever occured, not just over the recent past. Having said that, it does bother me a bit that the 16-20 demographic hits goes from 0% at 15 and under then stays pretty constant over the next 10-15 years. The sample size is decent though.
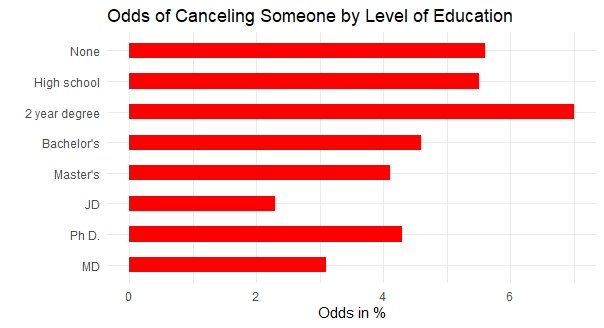
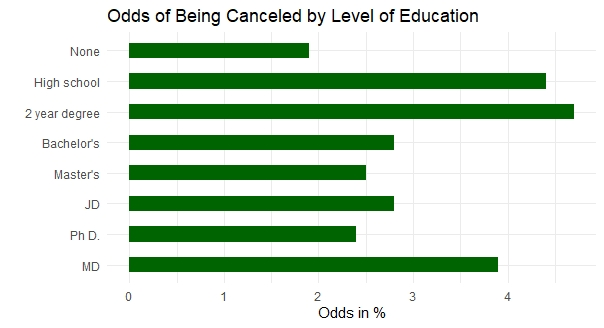
Again, cancellation is usually a concern around colleges and places of higher education and I've typically heard of it as a concern for the educated. Instead there's a really big, obvious gap between those without a four year degree and even a small but real decrease from a bachelor's degree to postgraduate.
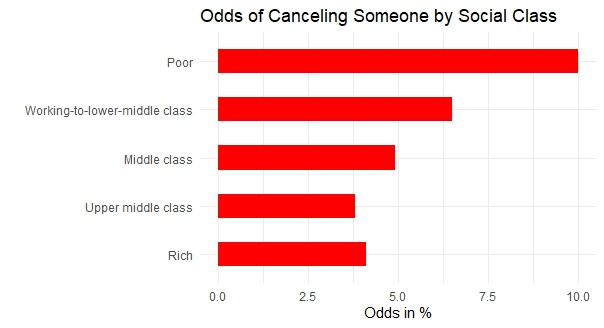
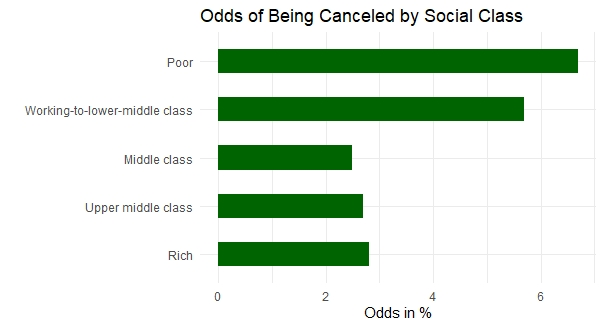
Couple notes. This is self-reported social class, for fairly obvious reasons, and we had 90 "Poor" people and 489 "Working-to-lower-middle class" people. I'm not super confident in the "Poor" result but the gap between "working" and "middle" class looks pretty darn real. And I think there's something wild but...
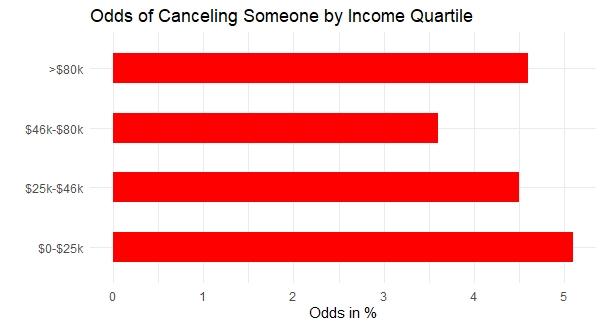
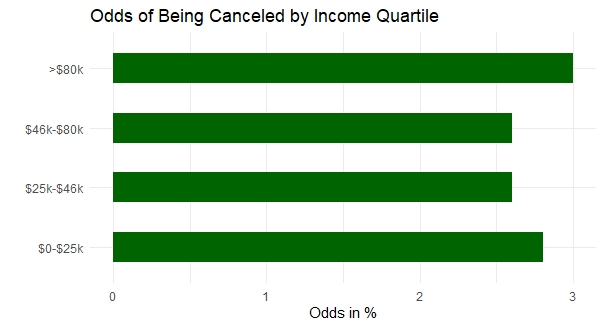
So this is wild to me and I don't understand it. I've sliced this data several different ways and I keep getting the same result: income does not have a big impact on either cancellation effect. I'm using a rough approximation of national US income quartiles from here but I've measured this multiple ways.
Maybe I'm doing something wrong, I'd love for someone to review my code and show me an error, maybe non-US citizens didn't convert their income to USD and they're disproportionately rich or poor or in some other way skewing these results. But highly educated, self-perceived high class people should be higher correlated with income.
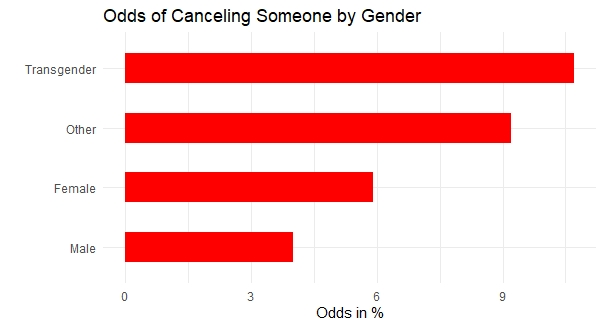
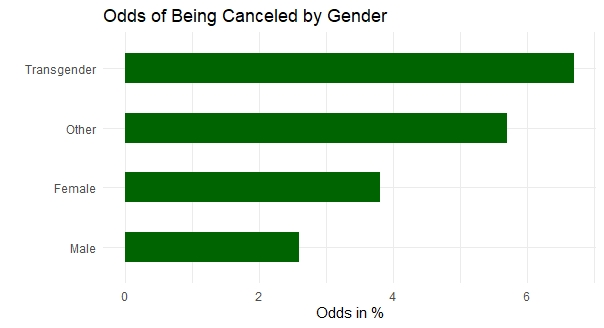
And finally, gender. Included mostly because the population is disproportionately transgender, so this is probably one of the better surveys around to capture how the transgender populations deals with cancellation. Having said that, there's a clear and obvious gender gap between men and women.
Alright, a few final notes here. I think there's an interesting story here. I think there's a story where, rather than thinking of cancellations at Harvard or elite college campuses as the norm, we should instead see them as rare and shocking. That rich, highly educated people do not burn valuable relationships, that's why they're rich. Instead, the people bearing the brunt of this social movement are...middle-aged women with little education or class.
But, even disregarding my concerns about income mentioned above, I fundamentally don't think this is the data set to tell that story. This data set is mostly highly educated, high income, male nerds. I trust that dataset to hint at a new story but I don't trust this data, with it's focus on different demographic groups, to tell that story.
But I think it is worth further investigation.
Life Satisfaction Factors
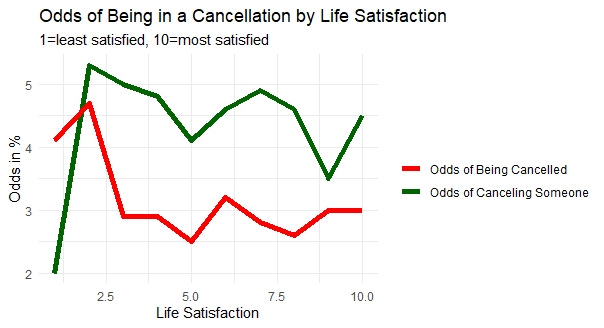
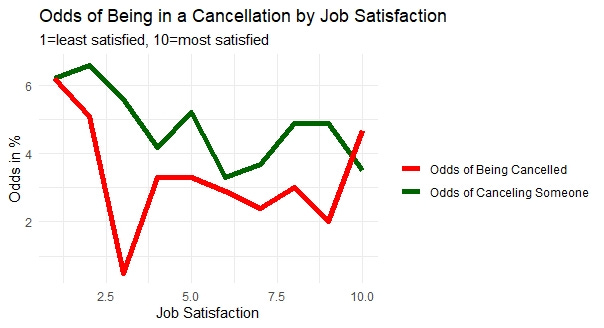
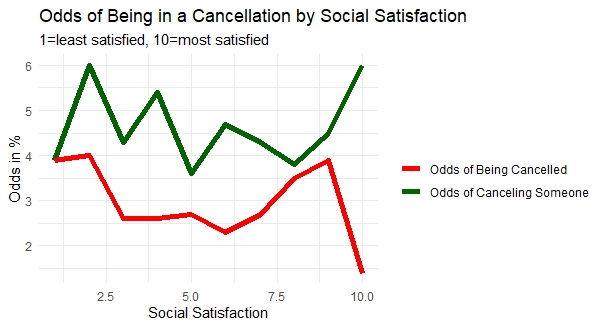
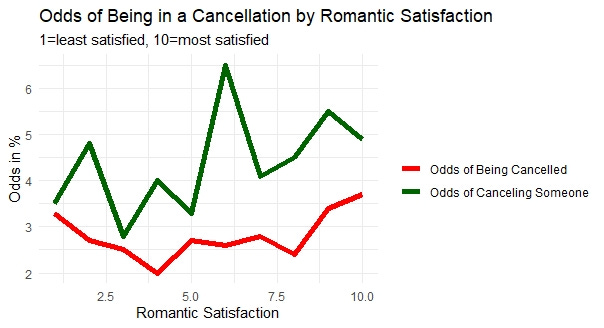
No results. I've heard, usually in a derogatory fashion, a lot of insinuations about the happiness and fulfillment of people who either cancel or complain about it. I thought I might find something interesting by looking at people's self reported satisfaction across a range of factors. I did not; at least I don't see any consistent trend below. It's being reported because, well, it's good practice to report that you didn't find something when you investigate it.
ML Classification Tree
So machine learning is hot right now, has been for awhile honestly, and we're going to do a bit of it right now but we're doing...probably the dumbest possible machine learning algorithm: classification trees. Why? We'll, because classification trees can be reasonably interpreted by a human being; they're just a long chain of if-else statements. Think less of neural nets with billions of parameters and more:
"Will it snow tomorrow?"
If Month=(December OR January OR February) AND state=Not Texas or Alabama then predict Snow=yes, otherwise predict Snow=no.
Which is obviously not ideal for making the best possible prediction but you can also explain every step of the algorithm to a reasonably educated layman. More importantly, for our purposes, I'm curious which variables it thinks are most important, ie Degree or Political Party or...whatever, but I'm really curious, before I execute these algorithms, on which variables it thinks are most important and what connections it draws between them. For example, it might not find that Marxism in general is a useful predictor but it might find it's useful if and only if you have a PhD or have very high income. There's no way I, as a human being, can reasonably judge how political views and income and education and all these things intersect and influence each other but the algorithm can do all of this trivially.
#Post code notes
So the first and most important result is that the algorithm...doesn't really find anything significant. If the odds of something happening are, like 5% and it can be 95% accurate by just always predicting that it won't happen barring some extremely strong predictors. Which is exactly what happened here on the first couple attempts; I have to exaggerate the risk of cancellation by about 500% before we see something like a real decision tree. Which I think substantiates a point I've made before that, when we zoom in we can see what look like big gaps but zoom out and...nothing is really actionable.
Having said that I'm struggling a bit with the visualization, because it's actually human readable and it's a tree structure that you can actually follow but...you need to be able to zoom in and out, zoom in on part of the tree, follow the path, then zoom back out and follow another path. These images I'm including should be very high resolution and you should either be able to zoom in or download them and zoom in but...I really think they're highly communicative but I struggle to put them in a blog or paper format. Let me know how this goes.
Starting with the algorithm to predict whether someone will cancel someone.
Alright, let me walk you through this a bit. So, what the algorithm does is it asks:
"Has this person, politically, moved to the right, not moved, or moved in some non-normal way?" If so, predict they won't cancel somebody.
If they have moved to the left, the algorithm then asks, basically, are they a "1" on the political spectrum, ie an extreme leftist? If so, predict they will cancel someone.
If they have moved to the left but they're not at the extreme, it then asks how satisfied they are with their job, which I dismissed as an important factor and we'll touch on in a bit.
If they're dissatisfied with their job and they're a Marxist, Libertarian, or Neoreactionary, it predicts they will cancel somebody.
If they're satisfied with their job and they're not poor, it predicts they won't cancel someone, but if they are satisfied but poor, it predicts they will cancel.
I hope that helps you read through the tree and understand the output.
Here's the classification tree for someone being canceled:
Without going into as much detail, I'm curious that this one targets political interest and looks into age but...really weird age categories are included and excluded. Both social class and job satisfaction show up again.
So let's go back to job satisfaction showing up in these algorithms, and in general a whole bunch of factors that I wasn't sold on showing up and some I would have guessed mattering a lot, like, gender, just not being a factor. I think it's worth taking these with a grain of salt, we're certainly all familiar with ML algorithms "hallucinating" or interpreting noise as real statistical facts but...ya know what other computing machine often misinterprets or hallucinates with statistics? My brain and your brain. In general, I would encourage you not to take either my analysis or the ML algorithm's analysis as foolproof, we're both very, very flawed. Instead, I would say that we both have systemic flaws but we don't have the same flaws, we make very different mistakes, and there's definitely some common factors here, mostly centering around those political factors we discussed at the start. If the human being and the machine are both saying the same thing...you can probs be reasonably confident in that being true.
Summary
I hate summaries, because it always sounds like rehashing what I've just said but, like, with less detail. Anyway, having written this out over awhile, here's the stuff that has stuck with me. First, in general, there's little actionable here and I should probably be less concerned about being cancelled, although I'm still not using my real name :P Cancellations are definitely politically influenced but...again, not usually in an actionable way. If someone's an extreme lefty and they just moved to the left, yeah, that moves into a different category but if Democrats are 3% likely to be canceled and Republicans are 6% likely, that's interesting at the societal level but not the interpersonal level. Also, most of the traditional factors for cancellation risk, like high education or high income, aren't high risk factors, they may not be low risk factors, I'd want further research, but in general my prior that people with a Bachelors or higher are at greater risk than people with lower education is probably false.
Finally, I dunno, not a beg but being straight up: if you like this and you want more stuff like this, gimme a sub, share it around, all that good stuff. I, like all other human beings, respond well to positive incentives and this didn't get made because I, like, have a plan of being a big blogger, it got made because the interest bug bit me and if I'm going to do it anyway, might as well post it. If it gets a positive response, if I can buy some bourbon off a blog, well, that sounds pretty awesome and...disproportionately motivational but if it doesn't...well, I try stuff, sometimes it works out, no problem but it's hard to...rationally defend the amount of time and code I put into this.
PS: I'm surprised I don't see more stuff done with the ACX survey. I thought about trying to run a survey on Mechanical Turk after the income/social class results, see if those results held up amongst the general population, but the survey is like 160 questions, so at least 15 minutes to take the survey, so at least $2 for someone to complete it, then to get 7000 respondents at $2 a pop means ~$15k to reproduce this, even without paying extra for surveying, well, rich nerds.
R Code
So, I know traditionally in R markdown or Juypter notebooks or whatever that the code is interspersed with the text and graphs...and more importantly, Gwern does that but, meh. I mean, it feels like flashing code to impress people but not actually have them use it. So instead I'm going to try just a huge chunk of code at the bottom because, well, that's the easiest way for you to go download the code and run it and do your own thing with it, which is what I want. If I do something like this again, I may go back to the traditional, code interspersed method, so let me know which you prefer:
require(ggplot2)df<-read.csv("https://slatestarcodex.com/Stuff/ACXSPublic2022.csv" , stringsAsFactors = F)cleaned_df<-df[, c(1,2,4,5,12,46,49, 35,36,37,38,39, 66,67,68,69, 143,144)]colnames(cleaned_df)<-c("Age", "Country", "Sex", "Gender" , "Degree", "Income", "Social_Class" , "Political_Spectrum", "Political_Interest" , "Political_Affiliation", "US_Party" , "Political_Change", "Life_Satis", "Job_Satis" , "Social_Satis", "Romantic_Satis" , "Canceled_Someone", "Been_Canceled")cleaned_df$Row_counter<-1cleaned_df$Canceled_Someone[cleaned_df$Canceled_Someone==""]<-"No"cleaned_df$Been_Canceled[cleaned_df$Been_Canceled==""]<-"No"cleaned_df$Canceled_Someone_Flag<-ifelse(cleaned_df$Canceled_Someone=="Yes", 1, 0)cleaned_df$Been_Canceled_Flag<-ifelse(cleaned_df$Been_Canceled=="Yes", 1, 0)cleaned_df$Country<-ifelse(cleaned_df$Country %in% c("United States", "United Kingdom", "Canada", "Germany"), cleaned_df$Country, "Other")cleaned_df$Income<-ifelse(cleaned_df$Income=="> 500,000", "750000", cleaned_df$Income)cleaned_df$Income<-ifelse(cleaned_df$Income=="", as.character(median(as.integer(cleaned_df$Income), na.rm=T)), cleaned_df$Income)cleaned_df$Income<-as.integer(cleaned_df$Income)#https://dqydj.com/income-percentile-calculator/cleaned_df$Income_Quartile<-ifelse(cleaned_df$Income<25000, "$0-$25k", "0")cleaned_df$Income_Quartile<-ifelse(cleaned_df$Income<46001 & cleaned_df$Income>=25000, "$25k-$46k", cleaned_df$Income_Quartile)cleaned_df$Income_Quartile<-ifelse(cleaned_df$Income<80002 & cleaned_df$Income>=46001, "$46k-$80k", cleaned_df$Income_Quartile)cleaned_df$Income_Quartile<-ifelse(cleaned_df$Income>=80002, ">$80k", cleaned_df$Income_Quartile)cleaned_df$Gender_clean<-cleaned_df$Gendercleaned_df$Gender_clean<-ifelse(cleaned_df$Gender_clean=="M (transgender f -> m)", "Transgender", cleaned_df$Gender_clean)cleaned_df$Gender_clean<-ifelse(cleaned_df$Gender_clean=="F (transgender m -> f)", "Transgender", cleaned_df$Gender_clean)cleaned_df$Gender_clean<-ifelse(cleaned_df$Gender_clean=="M (cisgender)", "Male", cleaned_df$Gender_clean)cleaned_df$Gender_clean<-ifelse(cleaned_df$Gender_clean=="F (cisgender)", "Female", cleaned_df$Gender_clean)cleaned_df$Political_Affiliation[grep("Marxist", cleaned_df$Political_Affiliation)]<-"Marxist"cleaned_df$Political_Affiliation[grep("Liberal", cleaned_df$Political_Affiliation)]<-"Liberal"cleaned_df$Political_Affiliation[grep("Conservative", cleaned_df$Political_Affiliation)]<-"Conservative"cleaned_df$Political_Affiliation[grep("Alt-right", cleaned_df$Political_Affiliation)]<-"Alt-Right"cleaned_df$Political_Affiliation[grep("Libertarian", cleaned_df$Political_Affiliation)]<-"Libertarian"cleaned_df$Political_Affiliation[grep("Neoreactionary", cleaned_df$Political_Affiliation)]<-"Neoreactionary"cleaned_df$Political_Affiliation[grep("Social democratic", cleaned_df$Political_Affiliation)]<-"Social Democrat"str(cleaned_df)canceled_df<-cleaned_df[cleaned_df$Canceled_Someone=="Yes" | cleaned_df$Been_Canceled=="Yes",]sum(cleaned_df$Been_Canceled_Flag)sum(cleaned_df$Canceled_Someone_Flag)Cancelled_aggs<-function(z) { temp_df<-cbind(aggregate(as.formula(paste("Row_counter~", z, sep="", collapse="")), cleaned_df, sum) , aggregate(as.formula(paste("Canceled_Someone_Flag~", z, sep="", collapse="")), cleaned_df, FUN=sum)[2] , round(aggregate(as.formula(paste("Canceled_Someone_Flag~", z, sep="", collapse="")), cleaned_df, sum)[2]/aggregate(as.formula(paste("Row_counter~", z, sep="", collapse="")), cleaned_df, sum)[2], 3)*100 , aggregate(as.formula(paste("Been_Canceled_Flag~", z, sep="", collapse="")), cleaned_df, FUN=sum)[2] , round(aggregate(as.formula(paste("Been_Canceled_Flag~", z, sep="", collapse="")), cleaned_df, sum)[2]/aggregate(as.formula(paste("Row_counter~", z, sep="", collapse="")), cleaned_df, sum)[2], 3)*100 ) colnames(temp_df)<-c(z, "Total_Population","Total_Cancelled_Other", "Odds_of_Canceling_Other", "Total_Cancelled_Self", "Odds_of_Being_Canceled") return(temp_df)}#Political AffiliationPAPS_df<-Cancelled_aggs("Political_Spectrum")[, c(1,4,6)]#Graph 1ggplot(PAPS_df[PAPS_df$Political_Spectrum>1 & PAPS_df$Political_Spectrum<10,] , aes(x=Political_Spectrum, y=Odds_of_Canceling_Other))+ geom_line(aes(color="Odds of Canceling Someone"), lwd=2)+ scale_color_manual(values=c("red"))+ labs(title="Odds of Canceling Someone by Political Spectrum" , subtitle="1=furthest left, 10=furthest right" , x="Political Spectrum", y="Odds in %", colour="")+ theme_minimal()#Graph 2ggplot(PAPS_df[PAPS_df$Political_Spectrum>1 & PAPS_df$Political_Spectrum<10,] , aes(x=Political_Spectrum, y=Odds_of_Canceling_Other))+ geom_line(aes(y=Odds_of_Being_Canceled, color="Odds of Being Cancelled"), lwd=2)+ scale_color_manual(values=c("darkgreen"))+ labs(title="Odds of Being Cancelled by Political Spectrum" , subtitle="1=furthest left, 10=furthest right" , x="Political Spectrum", y="Odds in %", colour="")+ theme_minimal()#Graph3ggplot(PAPS_df , aes(x=Political_Spectrum, y=Odds_of_Canceling_Other))+ geom_line(aes(color="Odds of Canceling Someone"), lwd=2)+ geom_line(aes(y=Odds_of_Being_Canceled, color="Odds of Being Cancelled"), lwd=2)+ scale_color_manual(values=c("red", "darkgreen"))+ labs(title="Odds of Being in a Cancellation by Political Spectrum" , subtitle="1=furthest left, 10=furthest right" , x="Political Spectrum", y="Odds in %", colour="")+ theme_minimal()PAPA_df<-Cancelled_aggs("Political_Affiliation")PAPA_df<-PAPA_df[PAPA_df$Political_Affiliation!="",]PAPA_df[, c(1, 4,6)]PAPA_df$Political_Affiliation<-factor(PAPA_df$Political_Affiliation, levels=rev(c("Marxist", "Social Democrat", "Liberal", "Conservative", "Libertarian", "Neoreactionary", "Alt-Right")))#Graph1ggplot(PAPA_df[, c(1,4)], aes(x=Political_Affiliation, y=Odds_of_Canceling_Other))+ geom_col(width=0.5, fill="red")+ coord_flip()+ labs(title="Odds of Canceling Someone by Political Affiliation" , x="Political Group", y="Odds in %", colour="")+ theme_minimal()#Graph2ggplot(PAPA_df[, c(1,6)], aes(x=Political_Affiliation, y=Odds_of_Being_Canceled))+ geom_col(width=0.5, fill="darkgreen")+ coord_flip()+ labs(title="Odds of Being Cancelled by Political Affiliation" , x="Political Group", y="Odds in %", colour="")+ theme_minimal()PAUP_df<-Cancelled_aggs("US_Party")[, c(1,4,6)]PAUP_df<-PAUP_df[PAUP_df$US_Party!="",]PAUP_df<-PAUP_df[PAUP_df$US_Party!="(option for non-Americans who want an option)",] #sorry, you're distractingPAUP_df<-PAUP_df[PAUP_df$US_Party!="Other third party",] #sorry, you're distracting AND smallPAUP_df$US_Party[grep("Not registered", PAUP_df$US_Party)]<-"No party registration"PAUP_df$US_Party<-factor(PAUP_df$US_Party, levels=c("Republican Party", "Libertarian Party", "No party registration", "Democratic Party"))PAUP_df#Graph 1ggplot(PAUP_df[, c(1,2)], aes(x=US_Party, y=Odds_of_Canceling_Other))+ geom_col(width=0.5, fill="red")+ coord_flip()+ labs(title="Odds of Canceling Someone by Political Affiliation" , x="US Party", y="Odds in %", colour="")+ theme_minimal()ggplot(PAUP_df[, c(1,3)], aes(x=US_Party, y=Odds_of_Being_Canceled))+ geom_col(width=0.5, fill="darkgreen")+ coord_flip()+ labs(title="Odds of Being Cancelled by Political Affiliation" , x="US Party", y="Odds in %", colour="")+ theme_minimal()PAPI_df<-Cancelled_aggs("Political_Interest")[, c(1,4,6)]ggplot(PAPI_df , aes(x=Political_Interest, y=Odds_of_Canceling_Other))+ geom_line(aes(color="Odds of Canceling Someone"), lwd=2)+ geom_line(aes(y=Odds_of_Being_Canceled, color="Odds of Being Cancelled"), lwd=2)+ scale_color_manual(values=c("red", "darkgreen"))+ labs(title="Odds of Being in a Cancellation by Political Interest" , subtitle="1=lowest interest, 5=highest interest" , x="Political Interest", y="Odds in %", colour="")+ theme_minimal()PAPC_df<-Cancelled_aggs("Political_Change")[, c(1,4,6)]PAPC_df<-PAPC_df[PAPC_df$Political_Change!="", ]PAPC_df$Political_Change[PAPC_df$Political_Change=="Some other change not easily described in those terms"]<-"Other change"PAPC_df$Political_Change<-factor(PAPC_df$Political_Change, levels=c("Become significantly further right" , "No significant change" , "Other change" , "Become significantly further left"))ggplot(PAPC_df[, c(1,2)], aes(x=Political_Change, y=Odds_of_Canceling_Other))+ geom_col(width=0.5, fill="red")+ coord_flip()+ labs(title="Odds of Canceling Someone by Change in Politics" , x="", y="Odds in %", colour="")+ theme_minimal()ggplot(PAPC_df[, c(1,3)], aes(x=Political_Change, y=Odds_of_Being_Canceled))+ geom_col(width=0.5, fill="darkgreen")+ coord_flip()+ labs(title="Odds of Being Cancelled by Change in Politics" , x="", y="Odds in %", colour="")+ theme_minimal()DA_df<-Cancelled_aggs("Age")[, c(1,4,6)]DA_df<-DA_df[DA_df$Age!="", ]DA_df<-DA_df[DA_df$Age!="<= 15", ]DA_df<-DA_df[DA_df$Age!="71 – 75", ]DA_df<-DA_df[DA_df$Age!="76 – 80", ]DA_df<-DA_df[DA_df$Age!="81 – 85", ]DA_df<-DA_df[DA_df$Age!="86 – 90", ]ggplot(DA_df[, c(1,2)], aes(x=Age, y=Odds_of_Canceling_Other))+ geom_col(width=0.5, fill="red")+ coord_flip()+ labs(title="Odds of Canceling Someone by Age" , x="", y="Odds in %", colour="")+ theme_minimal()ggplot(DA_df[, c(1,3)], aes(x=Age, y=Odds_of_Being_Canceled))+ geom_col(width=0.5, fill="darkgreen")+ coord_flip()+ labs(title="Odds of Being Canceled by Age" , x="", y="Odds in %", colour="")+ theme_minimal()DD_df<-Cancelled_aggs("Degree")[, c(1,4,6)]DD_df<-DD_df[DD_df$Degree!="", ]DD_df<-DD_df[DD_df$Degree!="Other professional degree", ]DD_df$Degree<-factor(DD_df$Degree, levels=c( "MD" , "Ph D." , "JD" , "Master's" , "Bachelor's" , "2 year degree" , "High school" , "None"))ggplot(DD_df[, c(1,2)], aes(x=Degree, y=Odds_of_Canceling_Other))+ geom_col(width=0.5, fill="red")+ coord_flip()+ labs(title="Odds of Canceling Someone by Level of Education" , x="", y="Odds in %", colour="")+ theme_minimal()ggplot(DD_df[, c(1,3)], aes(x=Degree, y=Odds_of_Being_Canceled))+ geom_col(width=0.5, fill="darkgreen")+ coord_flip()+ labs(title="Odds of Being Canceled by Level of Education" , x="", y="Odds in %", colour="")+ theme_minimal()Cancelled_aggs("Social_Class")DSC_df<-Cancelled_aggs("Social_Class")[, c(1,4,6)]DSC_df<-DSC_df[DSC_df$Social_Class!="", ]DSC_df$Social_Class<-factor(DSC_df$Social_Class, levels=c( "Rich" , "Upper middle class" , "Middle class" , "Working-to-lower-middle class" , "Poor"))ggplot(DSC_df[, c(1,2)], aes(x=Social_Class, y=Odds_of_Canceling_Other))+ geom_col(width=0.5, fill="red")+ coord_flip()+ labs(title="Odds of Canceling Someone by Social Class" , x="", y="Odds in %", colour="")+ theme_minimal()ggplot(DSC_df[, c(1,3)], aes(x=Social_Class, y=Odds_of_Being_Canceled))+ geom_col(width=0.5, fill="darkgreen")+ coord_flip()+ labs(title="Odds of Being Canceled by Social Class" , x="", y="Odds in %", colour="")+ theme_minimal()#he he heDIQ_df<-Cancelled_aggs("Income_Quartile")[, c(1,4,6)]ggplot(DIQ_df[, c(1,2)], aes(x=Income_Quartile, y=Odds_of_Canceling_Other))+ geom_col(width=0.5, fill="red")+ coord_flip()+ labs(title="Odds of Canceling Someone by Income Quartile" , x="", y="Odds in %", colour="")+ theme_minimal()ggplot(DIQ_df[, c(1,3)], aes(x=Income_Quartile, y=Odds_of_Being_Canceled))+ geom_col(width=0.5, fill="darkgreen")+ coord_flip()+ labs(title="Odds of Being Canceled by Income Quartile" , x="", y="Odds in %", colour="")+ theme_minimal()DG_df<-Cancelled_aggs("Gender_clean")[,c(1,4,6)]DG_df<-DG_df[DG_df$Gender_clean!="",]DG_df$Gender_clean<-factor(DG_df$Gender_clean, levels=c("Male" , "Female" , "Other" , "Transgender"))ggplot(DG_df[, c(1,2)], aes(x=Gender_clean, y=Odds_of_Canceling_Other))+ geom_col(width=0.5, fill="red")+ coord_flip()+ labs(title="Odds of Canceling Someone by Gender" , x="", y="Odds in %", colour="")+ theme_minimal()ggplot(DG_df[, c(1,3)], aes(x=Gender_clean, y=Odds_of_Being_Canceled))+ geom_col(width=0.5, fill="darkgreen")+ coord_flip()+ labs(title="Odds of Being Canceled by Gender" , x="", y="Odds in %", colour="")+ theme_minimal()LSLS_df<-Cancelled_aggs("Life_Satis")ggplot(LSLS_df , aes(x=Life_Satis, y=Odds_of_Canceling_Other))+ geom_line(aes(color="Odds of Canceling Someone"), lwd=2)+ geom_line(aes(y=Odds_of_Being_Canceled, color="Odds of Being Cancelled"), lwd=2)+ scale_color_manual(values=c("red", "darkgreen"))+ labs(title="Odds of Being in a Cancellation by Life Satisfaction" , subtitle="1=least satisfied, 10=most satisfied" , x="Life Satisfaction", y="Odds in %", colour="")+ theme_minimal()LSJS_df<-Cancelled_aggs("Job_Satis")ggplot(LSJS_df , aes(x=Job_Satis, y=Odds_of_Canceling_Other))+ geom_line(aes(color="Odds of Canceling Someone"), lwd=2)+ geom_line(aes(y=Odds_of_Being_Canceled, color="Odds of Being Cancelled"), lwd=2)+ scale_color_manual(values=c("red", "darkgreen"))+ labs(title="Odds of Being in a Cancellation by Job Satisfaction" , subtitle="1=least satisfied, 10=most satisfied" , x="Job Satisfaction", y="Odds in %", colour="")+ theme_minimal()LSSS_df<-Cancelled_aggs("Social_Satis")ggplot(LSSS_df , aes(x=Social_Satis, y=Odds_of_Canceling_Other))+ geom_line(aes(color="Odds of Canceling Someone"), lwd=2)+ geom_line(aes(y=Odds_of_Being_Canceled, color="Odds of Being Cancelled"), lwd=2)+ scale_color_manual(values=c("red", "darkgreen"))+ labs(title="Odds of Being in a Cancellation by Social Satisfaction" , subtitle="1=least satisfied, 10=most satisfied" , x="Social Satisfaction", y="Odds in %", colour="")+ theme_minimal()LSRS_df<-Cancelled_aggs("Romantic_Satis")ggplot(LSRS_df , aes(x=Romantic_Satis, y=Odds_of_Canceling_Other))+ geom_line(aes(color="Odds of Canceling Someone"), lwd=2)+ geom_line(aes(y=Odds_of_Being_Canceled, color="Odds of Being Cancelled"), lwd=2)+ scale_color_manual(values=c("red", "darkgreen"))+ labs(title="Odds of Being in a Cancellation by Romantic Satisfaction" , subtitle="1=least satisfied, 10=most satisfied" , x="Romantic Satisfaction", y="Odds in %", colour="")+ theme_minimal()require(rpart)require(rpart.plot)set.seed(742)cancel_df<-cleaned_dfcancel_df$Been_Canceled<-NULLcancel_df$Row_counter<-NULLcancel_df$Been_Canceled_Flag<-NULLcancel_df$Canceled_Someone_Flag<-NULLcancel_df<-rbind(cancel_df , cancel_df[cancel_df$Canceled_Someone=="Yes", ] , cancel_df[cancel_df$Canceled_Someone=="Yes", ] , cancel_df[cancel_df$Canceled_Someone=="Yes", ] , cancel_df[cancel_df$Canceled_Someone=="Yes", ] , cancel_df[cancel_df$Canceled_Someone=="Yes", ] , cancel_df[cancel_df$Canceled_Someone=="Yes", ])cancel_model<-rpart(Canceled_Someone~. , cancel_df , method = "class" , minsplit=2 , minbucket=2 , cp=0.008 )#Because I use RStudio and we need to print it out with much higher resolutionpng(file="cancel_model.png", width=480*4, height=480*4, res=500)rpart.plot(cancel_model)dev.off()canceled_df<-cleaned_dfcanceled_df$Canceled_Someone<-NULLcanceled_df$Row_counter<-NULLcanceled_df$Canceled_Someone_Flag<-NULLcanceled_df$Been_Canceled_Flag<-NULLcanceled_df<-rbind(canceled_df , canceled_df[canceled_df$Been_Canceled=="Yes", ] , canceled_df[canceled_df$Been_Canceled=="Yes", ] , canceled_df[canceled_df$Been_Canceled=="Yes", ] , canceled_df[canceled_df$Been_Canceled=="Yes", ] , canceled_df[canceled_df$Been_Canceled=="Yes", ] , canceled_df[canceled_df$Been_Canceled=="Yes", ])canceled_model<-rpart(Been_Canceled~. , canceled_df , method = "class" , minsplit=2 , minbucket=2 , cp=0.009)png(file="canceled_model.png", width=480*4, height=480*4, res=500)rpart.plot(canceled_model)dev.off()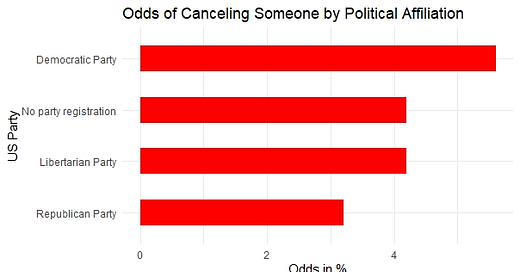





My totally biased guess about the correlation with political viewpoints:
1) a large chunk of people who also tend right wing will consider it their duty to "fix" their straying friend or family member. They'd much rather preach at their sinning family member, or punish them, than cut them off. (The well publicized tendency to expel and shun gay offspring - especially prominent some decades ago -would seem to directly contradict this, but I'm guessing the numbers were smaller than the chronic attempts at re-conversion.)
2) the idea of cutting off "toxic" people and "toxic" relationships seems to be encouraged in therapy culture (not necc. the same as by actual therapists). It's especially supported in all kinds of support groups for people with various problems. Possibly this comes originally from advice commonly given to those dealing with addicts - they are commonly advised that you can't help the addict in your life; all you can do is farther enable their addiction.
So when the "relationship" degenerates towards an end state of fighting about politics - or worse, fighting about whether or not the person on the left is some kind of sinner, needing to repent - the one on the left is more likely to pull the plug.
No data to support this except anecdata, from observing the large number of queers and ex-Christians among my acquaintances.
I don't think people call it "cancelling" when its just one person deciding to cut contact with another, cancelling has always implied a mob to me. Strange wording choice.
Anyway, I do question a little how much can really be learned from dividing this into cutting off vs. being cut off. For example, take a scenario where a queer person comes out or begins to make queer lifestyle decisions (marriage etc), and then conservative family members react with sustained disapproval and hostility. Regardless of whether the final action of cutting off was initiated by the queer person ("I cant take this anymore") or by the other family members ("You're no longer allowed around my children"), it seems that the arrow of causation still points the same way. Maybe both parties would disagree about which cut the other off, or whether an example like this counts as being cut off "over politics".
I think when it comes to personal values, we could guess that for example liberal people are more likely to see cutting off a family member as the appropriate response to the tensions in a relationship, but that doesn't necessarily tell us much about the interpersonal family dynamics that actually lead to people cutting one another off, and by extension your likelihood of being cut off by or cutting off a family member in the future.